

If your VPS server is running into network issues, MTR, also known as My traceroute, can prove a vital tool. Using it, you can generate a detailed report to pass on to a support agent or study yourself.
What is MTR?
MTR is a popular networking tool that provides the features of traceroute and ping in a single, lightweight program. To provide a detailed output, it sends ICMP packets to a target server and listens to the responses of their expiry.
MTR sends packets with increasing TTLs so that it can examine the full route a packet takes to its destination. While doing so, it collects data about the responsiveness, state, and connection of the intermediate hosts, providing a robust look at the links between them.
How to install MTR and generate an MTR report
MTR is available on all major desktop OSes, including Windows, Mac, and Linux. It's worth noting, however, that the Windows client is a port of MTR, known as "WinMTR". Here's how to get each:
- Linux:
- Debian/Ubuntu:
sudo apt install mtr-tiny - CentOS/Fedora/RHEL:
yum install mtr
- Debian/Ubuntu:
- Windows:
- WinMTR download
- MacOS:
- Homebrew:
brew install mtr - MacPorts:
port install mtr
- Homebrew:
We generally recommend generating reports both to and from your VPS if possible. Though it's not common, MTR may detect errors from one direction but not other. This is because the route between two hosts can vary depending on the host's location and surrounding internet infrastructure.
Create an MTR report on Linux or MacOS
Generating an MTR report on Unix-based systems is done through the terminal. Let's use the situation we run into most commonly as an example: network issues between a local PC and a VPS host.
To test the connection to the VPS, we would run the following command via MTR on our local PC:
mtr -rw 12.34.567.890
The -rw option enables reports (r), and full hostname output (w). Naturally, you would replace the IP address in this case with your server IP. However, you can also define a website if required, like so:
mtr -rw bitlaunch.io
Now to check the connection from the VPS to our local PC so we can cover the full range of possibilities:
mtr -rw 098.76.543.210
Change the IP address to that of your local PC, which you can find with a simple DuckDuckGo search.
If the tool detects no packet loss, it may be necessary to increase the frequency at which it sends packets. To do so, we can use the c option to modify the number of packets that are sent and recorded:
sudo mtr -rwc 50 -rw 12.245.678.90
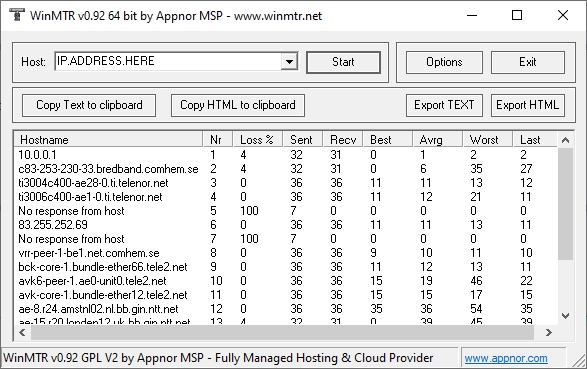
Create an MTR report on Windows
Creating an MTR report on Windows is even easier and is managed directly from WinMTR's UI. Enter the IP or domain name of the target host in the "Host" bar, then press Start. WinMTR will continue sending packets until you press the Stop button.
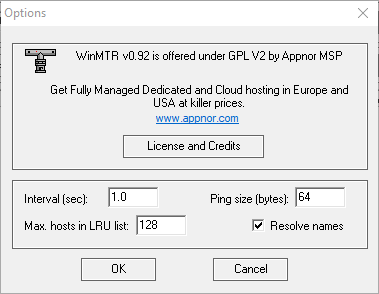
You can export the information as a report with the Export TEXT or Export HTML buttons. If there's still no packet loss reported, you can up the frequency at which it sends packets by changing the Interval field. Here you can also adjust the maximum number of hosts and the ping size.
Understanding an MTR Report
The output of an MTR report can be quite confusing at first look. Here's an example:
HOST: 602a742c7437d20001bb8851   Loss%   Snt   Last   Avg  Best  Wrst StDev
  1.|-- 45.61.138.1                 0.0%    10   15.1  17.4   6.7  47.8  11.6
  2.|-- 10.10.10.253                0.0%    10    0.8   0.9   0.7   1.8   0.3
  3.|-- 77.67.124.45                0.0%    10    9.2  13.3   0.7  36.9  14.4
  4.|-- ae21.cr10-lon1.ip4.gtt.net  0.0%    10    0.8   3.3   0.8  16.4   4.9
  5.|-- 72.14.221.145               0.0%    10    1.6   1.6   1.5   2.0   0.1
  6.|-- 209.85.249.187              0.0%    10    1.6   1.7   1.5   1.9   0.1
  7.|-- 74.125.242.83               0.0%    10    2.1   2.2   2.0   2.6   0.2
  8.|-- 72.14.237.53               80.0%    10    2.0   2.0   2.0   2.1   0.1
  9.|-- 108.170.237.242            70.0%    10   24.3  17.0   7.3  24.3   8.7
 10.|-- 72.14.236.18               30.0%    10   10.1  16.5  10.0  51.1  15.3
 11.|-- 209.85.249.33              70.0%    10   40.2  41.8  40.1  45.0   2.8
 12.|-- 108.170.232.251             0.0%    10   41.8  41.5  41.3  41.8   0.1
 13.|-- 216.239.42.23               0.0%    10   41.9  41.9  41.5  42.2   0.2
The most important thing to know is that each numbered line represents a hop. The Loss% column shows the percentage of packets that were lost at each hop. Snt naturally shows the number of packets sent in total. The remaining four columns are a bit less intuitive, displaying the latency in milliseconds in various ways. Last shows the latency of the last packet sent and average the average of all packets sent. Best and Wrst show the shortest and longest time for a round trip packet to the host.
In most cases, then, you'll just be using the Avg column. However, there are some situations where you may not want to. The final column, StDev, helps to make that assessment, displaying the standard deviation of latencies for each hop. If it's high, this indicates that the average may not be accurate given the small sample size of 10 packets.
Typically, if you're testing from your local PC or VPS server and there's high loss or latency in the first few steps, it's an issue with your ISP. If the issue presents itself towards the end of the list, it's more likely to be a problem with the host. If it falls in the middle, it may, unfortunately, be difficult to address. It's more likely an infrastructural problem along the route that you and the operator will have a limited ability to address.
That said, it's worth noting that in some cases the packet loss and ping values you see may be the server rate limiting ICMP traffic. This is often the case if you see packet loss on one hop followed by 0% loss on the next. If you see packet loss on multiple hops in succession, it's more likely the packet loss is genuine. Whatever the case, bear in mind that a small amount of packet loss (<10%) is unlikely to seriously affect your experience.
Common issues
While some issues MTR flags will require contacting your provider, you can fix others at home or on the VPS with minimal technical knowledge. Others are simply misleading or don't present the full picture. Here are some examples we see frequently:
Misleading residential router reports
At times, residential gateways can report packet loss incorrectly.
HOST: 602a742c7437d20001bb8851   Loss%   Snt   Last   Avg  Best  Wrst StDev
  1.|-- 45.61.138.1                 0.0%    10   15.1  17.4   6.7  47.8  11.6
  2.|-- ???                       100.0%    10    0.8   0.9   0.7   1.8   0.3
  3.|-- 77.67.124.45                0.0%    10    9.2  13.3   0.7  36.9  14.4
  4.|-- ae21.cr10-lon1.ip4.gtt.net  0.0%    10    0.8   3.3   0.8  16.4   4.9
  5.|-- 72.14.221.145               0.0%    10    1.6   1.6   1.5   2.0   0.1
  6.|-- 209.85.249.187              0.0%    10    1.6   1.7   1.5   1.9   0.1
  7.|-- 74.125.242.83               0.0%    10    2.1   2.2   2.0   2.6   0.2
  8.|-- 72.14.237.53                0.0%    10    2.0   2.0   2.0   2.1   0.1
  9.|-- 108.170.237.242             0.0%    10   24.3  17.0   7.3  24.3   8.7
 10.|-- 72.14.236.18                0.0%    10   10.1  16.5  10.0  51.1  15.3
 11.|-- 209.85.249.33               0.0%    10   40.2  41.8  40.1  45.0   2.8
 12.|-- 108.170.232.251             0.0%    10   41.8  41.5  41.3  41.8   0.1
 13.|-- 216.239.42.23               0.0%    10   41.9  41.9  41.5  42.2   0.2
You can see that our second hop reports a packet loss of 100%, but there's no packet loss after that point. This suggests the result is an error, rather than an actual issue.
The destination server's firewall is configured incorrectly
In some cases, it can appear that packets are not reaching the remote server when in reality it's that the remote server isn't sending a response.
HOST: 602e3bfa7437d20001bb88b8                   Loss%   Snt   Last   Avg  Best  Wrst StDev
1.|-- 38.39.201.65                                0.0%    10    1.4   1.3   1.0   1.9   0.3
2.|-- 10.57.57.1                                  0.0%    10    1.2   1.1   0.9   1.4   0.2
3.|-- 10.10.6.1                                   0.0%    10    0.9   0.8   0.7   1.0   0.1
4.|-- 81.20.67.129                                0.0%    10    1.5   1.4   1.3   1.6   0.5
5.|-- ae-19.r25.amstnl02.nl.ntt.net             100.0%    10    0.0   0.0   0.0   0.0   0.0
This can happen if the networking or iptables aren't configured correctly on the remote host. The host may drop ICMP packets as a result and be unable to reply. To be sure this is the case, you must compare the MTR report to previous ones to check if the hop that has 100% loss is the final destination. This can be difficult if you don't have a report available from before the issue started, but it's worth keeping in mind.
Poorly configured ISP router
The problem can sometimes present itself on the ISP's end. This will often be characterized by several rows of question marks that aren't followed by a final destination IP:
HOST: 602e3bfa7437d20001bb88b8    Loss%   Snt   Last   Avg  Best  Wrst StDev
  1.|-- 38.39.201.65               0.0%    10    1.5   1.6   1.1   4.6   1.1
  2.|-- 10.57.57.1                 0.0%    10    1.5   1.2   0.9   1.5   0.2
  3.|-- 10.10.6.1                  0.0%    10    0.9   1.6   0.7   7.7   2.2
  4.|-- ae1-1989.cr4-ams2.ip4.gtt  0.0%    10    1.1   7.3   0.8  45.1  14.4
  5.|-- ae15.cr6-ams1.ip4.gtt.net  0.0%    10   12.1   7.6   1.3  23.7   8.2
  6.|-- 72.14.208.136              0.0%    10    1.4   7.2   1.0  55.4  17.0
  7.|-- 108.170.241.205            0.0%    10    1.7   1.8   1.6   2.2   0.2
  8.|-- 216.239.43.27             50.0%    10    1.5   1.6   1.5   1.8   0.1
  9.|-- 108.170.238.165            0.0%    10    2.5   2.9   2.1   7.0   1.5
 10.|-- 209.85.248.41              0.0%    10    2.3   2.2   2.0   2.3   0.1
 11.|-- ???                        0.0%    10    0.0   0.0   0.0   0.0   0.0
 12.|-- ???                        0.0%    10    0.0   0.0   0.0   0.0   0.0
 13.|-- ???                        0.0%    10    0.0   0.0   0.0   0.0   0.0
 14.|-- ???                        0.0%    10    0.0   0.0   0.0   0.0   0.0
 15.|-- ???                        0.0%    10    0.0   0.0   0.0   0.0   0.0
You may also see packets sent in a loop, with alternating IP addresses presented for several hops.
Most issues are temporary
If you do discover network issues via MTR, it's worth noting that the majority of network issues do not persist for a long period. In many cases, the service provider will already be aware of the problem and working to resolve it by the time you contact them. Additionally, no amount of maneuvering by the provider can override factors like your physical distance from the server or network congestion.
We've only covered the basics of MTR today, and won't dive into use of TCP/UDP packets, jitter diagnosis, and other MTR functionality just yet. However, if you do experience extended and unexpected degradation, a baisc MTR report may aid your support agent. While they won't expect you to be able to interpret it yourself, it offers them valuable data they can use to diagnose the issue.
If you do note network problems that are affecting your VPS usage, please reach out to BitLaunch support to see if we can help.
Not a part of BitLaunch yet? Sign up today and talk to support for free credit.