It’s a good idea to monitor the performance of any server, regardless of whether it’s exhibiting noticeable issues. Doing so occasionally can help an admin notice issues before they become a major problem, discover paths to optimization, and fix things if they do go awry.
Thankfully, there are numerous command-line tools such as systemctl to list services, iptables to monitor firewalls, or chown to change owners, all meant to aid in this, allowing for examination of resource, disk space, and network usage with no extra setup.
While multi-VPS management tools like Cockpit provide a nice overview of Linux server performance monitoring, there’s something to be said for getting down on the ground and examining things in more detail. We’re going to dive into some of the most useful command-line Linux performance management tools that are beneficial for any sysadmin, game server host, or WordPress user.
Read our in-depth guide to VPS server performance to learn what you should be looking for and how some VPS providers might try to trick you.
1. Use top or htop for network and Linux process monitoring
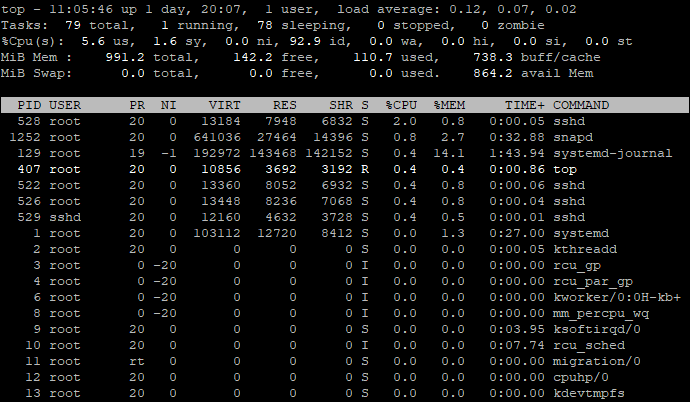
top is a trusty Linux performance monitor command that will be known to many sysadmins and regular users alike. Similarly to System Monitor in GUI-based distros, it returns a live list of processes and their CPU and memory usage. It also shows the time running and the command associated with them.
Meanwhile, the top of the output shows the total number of tasks, free and reserved memory, a total CPU usage percentage, and more. This often makes it the first point of call for general monitoring, though that’s also thanks to its memorability.
Running top gives the following output:
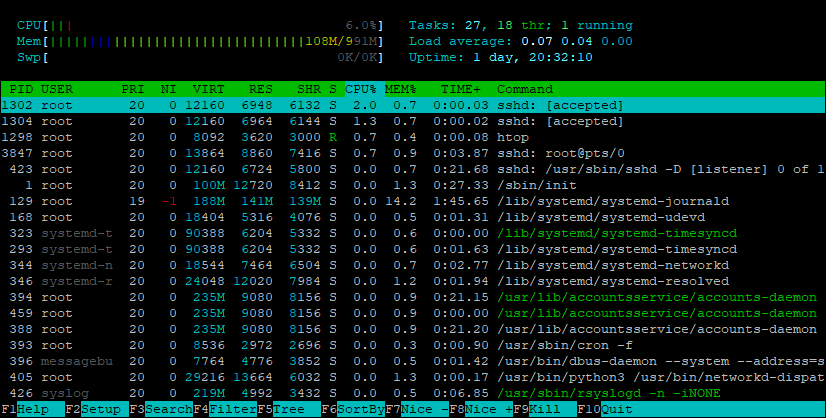
If you’re happy to install third-party Linux performance observability tools, Htop offers similar functionality but also integrates some more advanced features and makes management a lot more user-friendly. You can install and use it with:
sudo apt-get install htop OR yum install htop
2. Use netstat and tcpdump for Linux network performance monitoring
netstat is a utility that does what it says on the tin. It's one of the Linux monitoring commands that gives admins various statistics on incoming and outgoing TCP traffic, routing tables, network interfaces, and protocols. You can also use it for more specific tasks, such as listing all open ports and sockets, finding the number of listening programs on a port, or displaying services by PID. You can run it with:
sudo apt install net-tools OR yum install net-tools
netstat -a | more
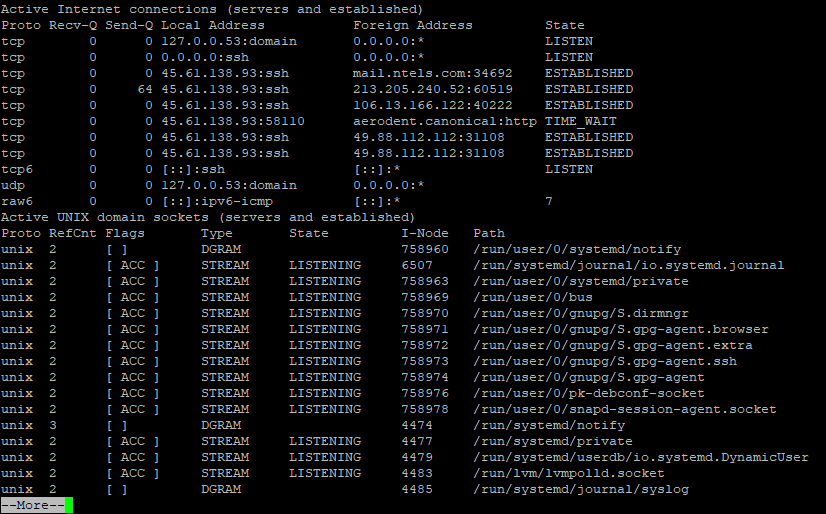
Alternatively, get network stats by protocol with netstat -st | less and process names/PIDs with sudo netstat -p -at

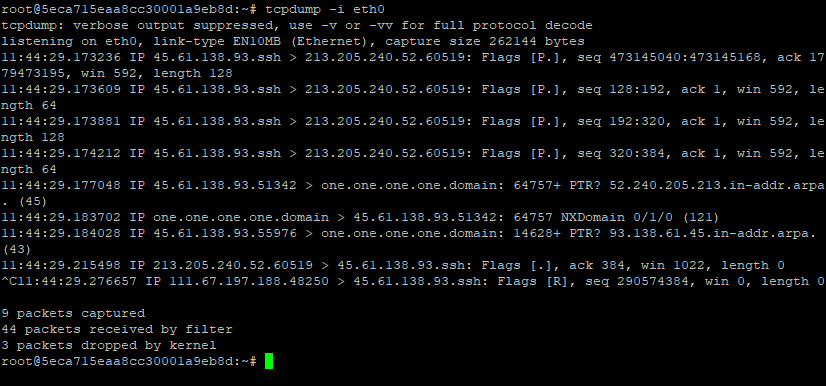
Meanwhile, tcpdump provides more advanced, real-time packet analysis/sniffing. Naturally, the focus is on TCP/IP packets, with the ability to filter and save the output for later analysis. This can be used to monitor for specific traffic, with a high number of packets SYN flags indicating a DOS attack, for example. You can avoid this with a DDoS protected VPS.
tcpdump is included on many distributions, but you have to install it manually on Red Hat or CentOS with sudo yum install -y tcpdump
The tcpdump command looks like this:
tcpdump -i eth0
3. Use iotop and iostat for Linux disk performance monitoring
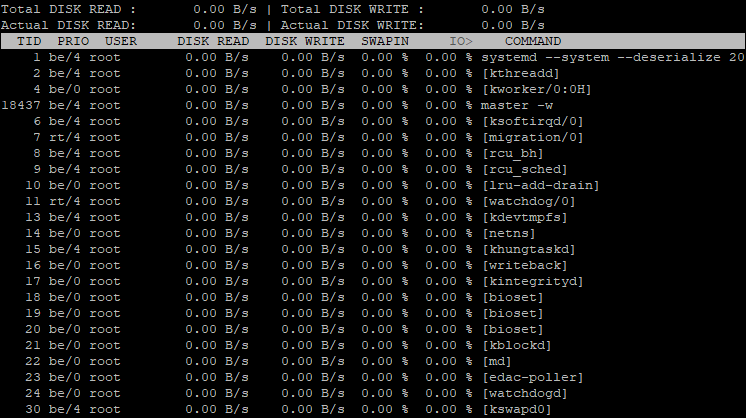
On the storage side of things, iotop provides Linux disk performance monitoring. Rather than the CPU/RAM stats seen in Top and Htop, it will display disk read, write, swap in, and IO for each process. This is a natural starting point if you’re trying to figure out what application is hogging disk resources. After installing it with your package manager of choice, you can view its output with iotop.
iostat is a very simple tool that gives a general overview of CPU and I/O usage for your system. As well as average CPU usage, it shows the CPU idle percentage and the percentage the CPU was idle while there was an outstanding I/O request. On a device level, it tells the admin the transfers per second, read/write per second, and total amount read and written.
You can install iostat with sudo apt-install sysstat OR yum install sysstat. Run it with iostat and find more options with iostat --help.

In the above iostat example, you can see that we have two disks, scd0 and sda, with statistics for their current read and write, as well as total amount read and written. Above that are our Linux performance stats. You should now have all the tools you need to keep an eye on your VPS performance.
Don't have a Linux machine? Sign up to BitLaunch and launch a VPS in Amsterdam, Bucharest, or the USA within minutes. Launch servers programmatically, or use our control panel to select from various regions and VPS providers.
